Mashups Midterm - Citibikes
 - March 19, 2018
For the “Mashups - creating with API’s” midterm we were asked to create a single page web experience that would respond to user input and return data from at least two public web API’s.
My initial plan was to create a world map based on the twitter “trends” api. For that reason a spent a lot of time trying to retrieve the data from twitter. This introduced me to the o_auth - a strict way to protect data making it hard to access. Actually, it turned out that it couldn’t be done. However this assignment taught me much about HTTP requests and the necessary elements of a Ajax Jquery call.
The structure requires you to include the jquery library. You then have to make an Jquery $.ajax request including:
- Url
- Headers (keys)
- Type (‘GET’ ‘Post’)
- DataType (‘json’ ‘jsonp’)
- Error
- Succes`
Example:
$.ajax({
   url: webcamUrl,
   headers: {
     "X-Mashape-Key": mashapeKey,
   },
   type: 'GET',
   dataType: "json",
   error: function(err) {
     console.log(err);
   },
   success: function(data) {
     Gdata = data;
     console.log("First data load");
     next();
     display();
   }
 })
}
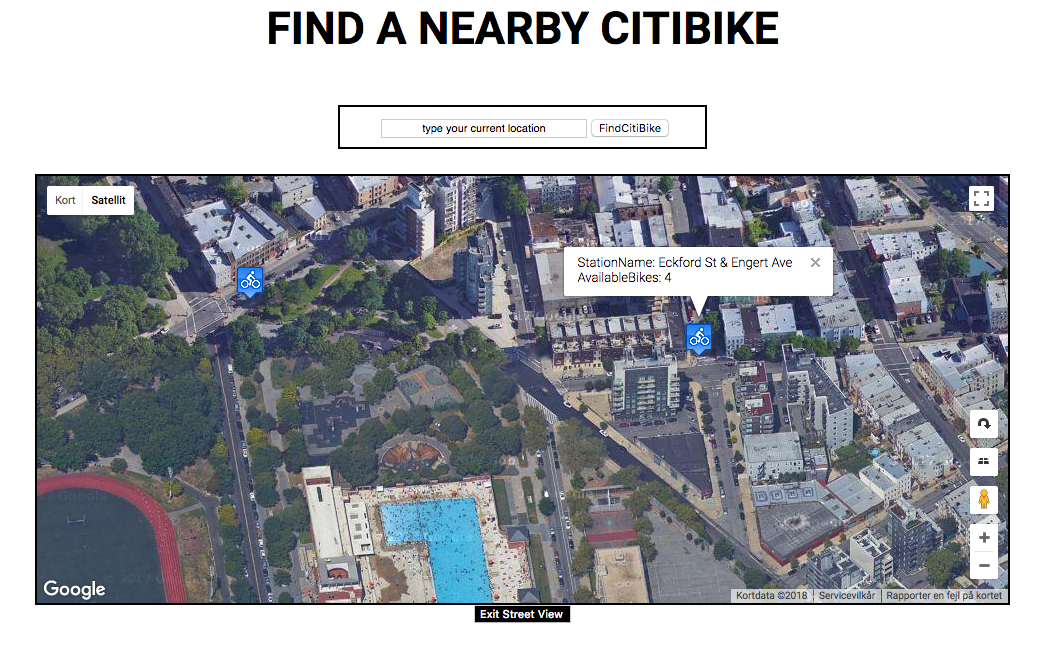
Instead of the twitter API I decided to use data from opendata New York. I wanted to combine it with the google Maps API to get more familiar with this resource. I chose a dataset on the NY citibikes and plotted in the location of station - in addition to that I wanted each station to display the number of available bikes.
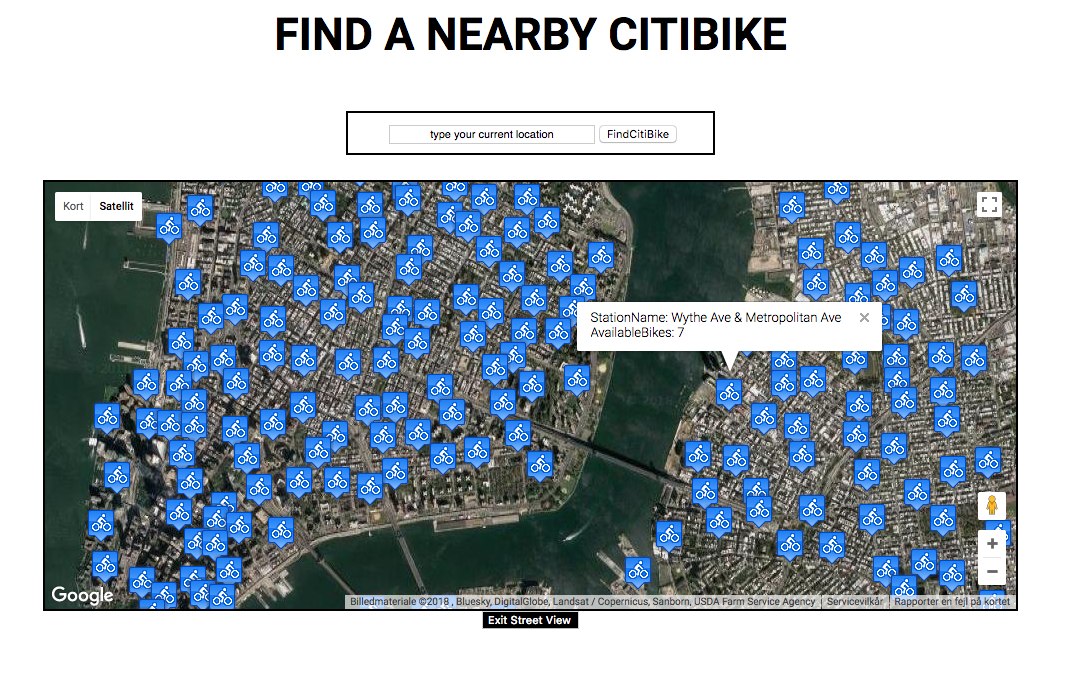
I had some problems including live data into the sketch - receiving a CORS error - “Cross- Origin resource sharing” - No ‘Access-Control-Allow-Origin’. I later found out that this could be fixed by toggling on the CORS chrome extension from here.
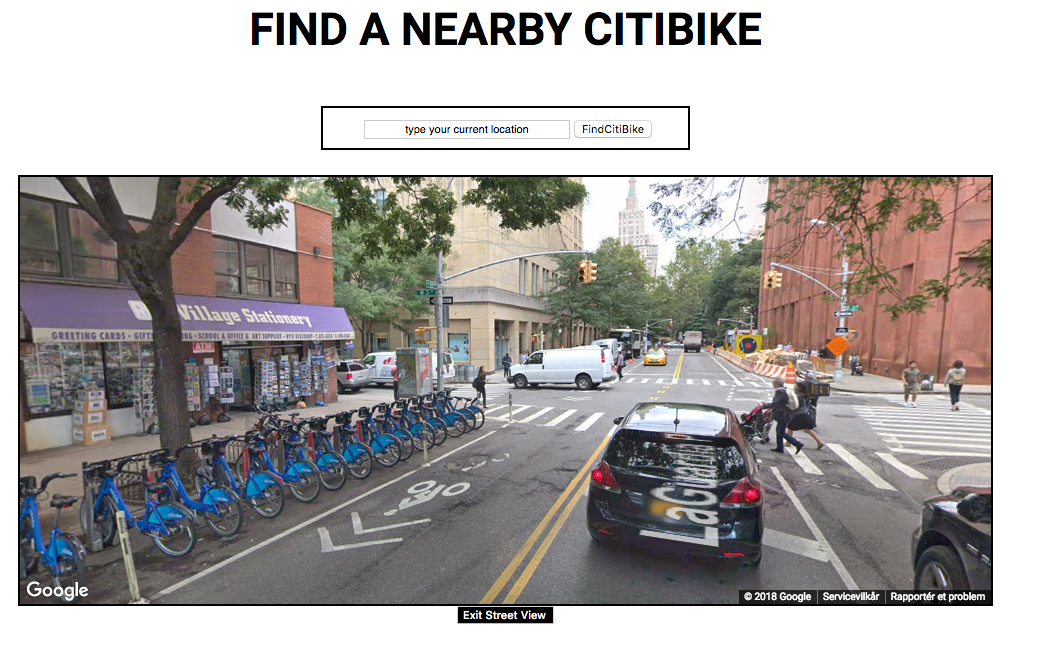
Aside from this I played around with the geocode function, the marker function and also the streetview function. I set it up so that whenever a station was clicked you would zoom into the streetview of that particular station.
The full code from this project can be found on github here