Mashups API - D3js
 - April 02, 2018
This week we were introduced to different programs for animation: three.js and d3.js. Our assignment was to get familiar with one of them and create a sketch using data from a different source.
For a while I have been wanting to get more familiar with d3. This week was my chance. I have seen some great animations made using this library and I see a lot of potential in the things you can create with it. To learn the basics I did some online tutorials - to figure out the syntax.
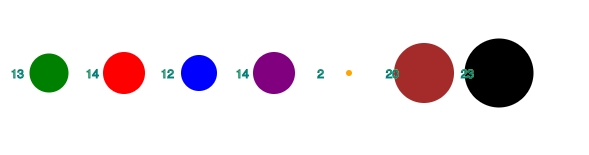
The first sketch was creating a line of circles. Their radius was based on simple dataset.
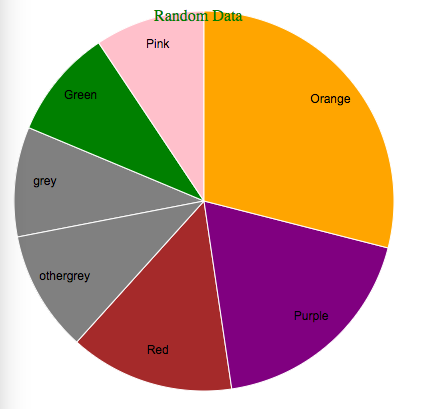
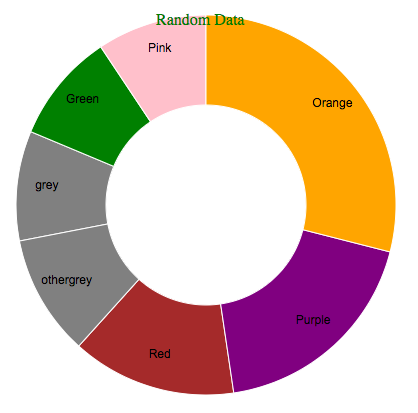
The next task was to create a pie-chart / donut-chart. These types of charts turned out to be very similar in their structure.
When learning more about the structure. I wanted to do something with animation. I found a well documented site using topojson a library that would outline different countries using a great number of line segments referred to as arcs. I downloaded the outline of Denmark and all its municipalities. With some difficulties I managed to make it work - especially finding my way into the interesting shapes was a struggle. After some work I had the outline of the map down. I then wanted it to be interactive and added a transition to each svg using the .on(mouseover, _____) function. And some minor fade-in effects when the document had loaded.
The next assignment will be to have each municipality display information. Also I would like to have the selected municipality move to the front when it is doing its animation.
The file can be seen here (it may be necessary to change the https request into a http in order for it to work): D3js Sketch Denmark
< !DOCTYPE html >
  <
  html >

  <
  head >
  <
  meta charset = "UTF-8" >
  <
  title > D3introsketch < /title> <
  script src = "https://d3js.org/d3.v3.min.js" > < /script> <
  script src = "http://d3js.org/topojson.v0.min.js" > < /script> <
link rel = "stylesheet"
href = "style.css" >

  <
  /script>

  <
  body >
  <
  script >
  var width = 900;
var height = 700;
var projection = d3.geo.mercator()
  .center([11.7, 56.3])
  .scale(6500)
  .translate([width / 2, height / 2])

var svg = d3.select("body").append("svg")
  .attr("width", width)
  .attr("height", height);

var path = d3.geo.path()
  .projection(projection);

var g = svg.append("g");

d3.json("Denmark.json", function(error, topology) {
  console.log(topology.objects.DNK_adm2.geometries[0].properties.NAME_2)
  //console.log(topology.objects.IND_adm1.geometries[0].properties.ID_1)
  g.selectAll("path")
    .data(topojson.object(topology, topology.objects.DNK_adm2)
      .geometries)
    .enter()
    .append("path")
    .attr("class", function(d, i) {
      //return "state" + topology.objects.IND_adm1.geometries[i].properties.ID_1;
      return "state";
    })
    .on("mouseover", handlemouseover)
    .on("mouseout", handlemouseout)

    // .attr("text-anchor", "middle")
    // .text(function(d,i) {
    //  return topology.objects.DNK_adm2.geometries[0].properties.NAME_2
    // })

    .attr("d", path);
})

d3.selectAll("svg")
  .attr("class", "path")
  .transition()
  .delay(1000)
  .duration(5000)
  .style("fill", "lightgreen");


function handlemouseover() {
  d3.select(this)
    .transition()
    .duration(2000)
    .attr("transform", "translate(0, -50)");
}

function handlemouseout() {
  d3.select(this)
    .transition()
    .duration(2000)
    .attr("transform", "translate(0, 0)");
}


d3.selection.prototype.moveToFront = function() {
  return this.each(function() {
    this.parentNode.appendChild(this);
  });
}; <
/script>

<
/body>


<
/html>