Data representation of a weekend
 - February 25, 2019
Expose a signal from some under-represented part of your body and try to correlate it with something from the environment.
For this assignment we had several options and a lot of equipment available. In class we were introduced to trackers of EEG, Eyes, Face, Heart, Sweat, Breath, Body and muscles. Trackers could be sensors, cameras, light etc.
I chose to go with an old familiar piece. Some years ago I would often wear a Polar chest strap and have it connected to my watch when I went for a run - however, this was many years ago. I was curious to see what type of information I could collect from one of the newest versions, when having it synchronized to my phone. One of the reason for going with this sensor is its reliability - I know the measurements are stable. During my first semester at ITP I tested EMG and ECG sensors. Although they do provide some feedback I did not find the results reproducible. Current EEG systems I have very little trust in.
For the polar sensor I first checked what measurements it would return and if I could export the raw data. This would make it more interesting to experiment with the data. I took it for a run around ITP
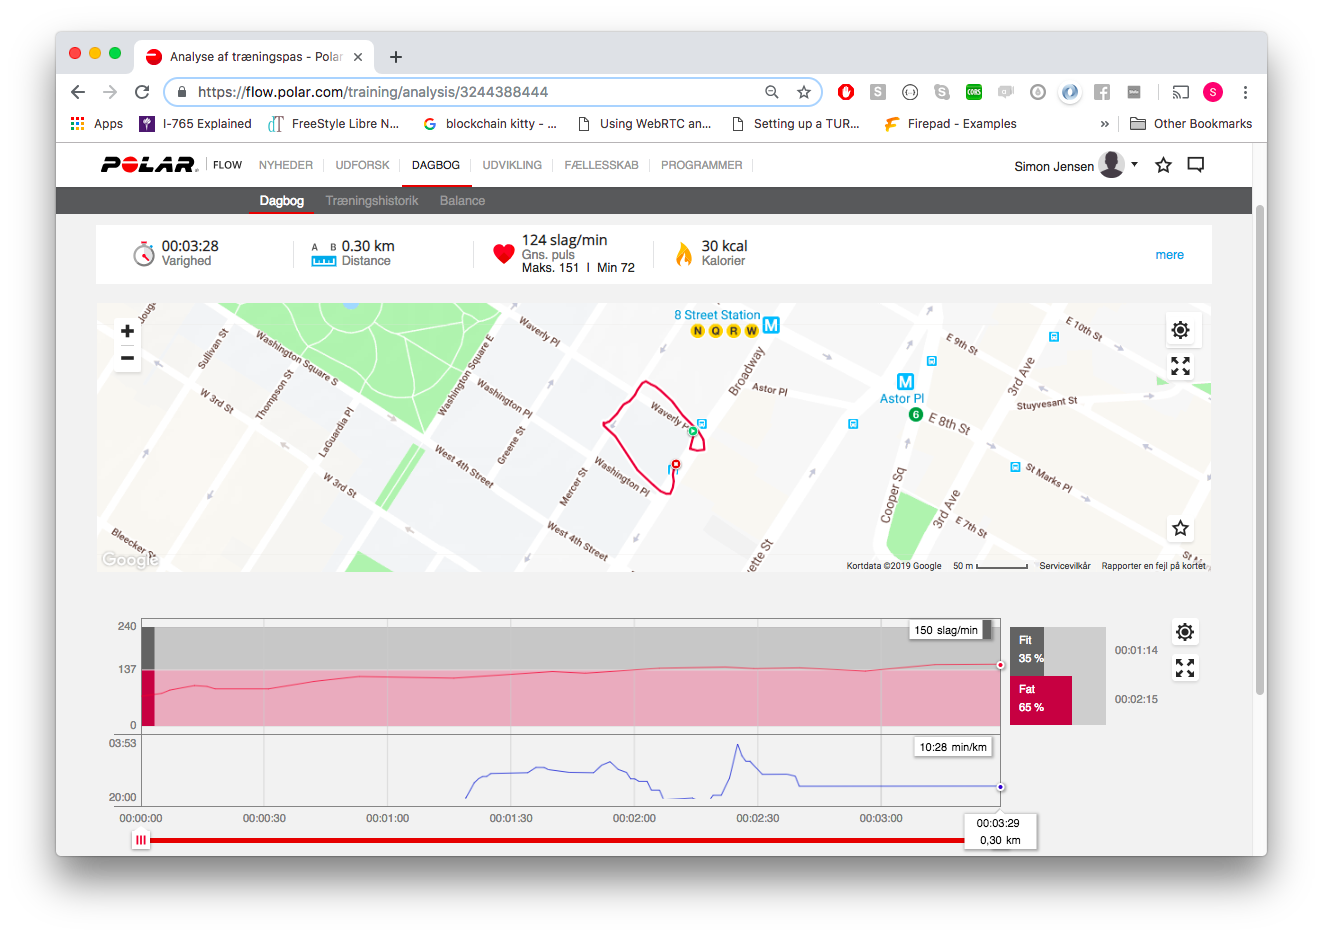
The image shows the feedback:
03:28 minute run around the block.
300 meter distance.
30 kcal burnt.
Steadily increasing pulse rate (red bar)
Blue line indicates speed.
I wanted to see the difference in numbers over two days when wearing the watch for 10 hours continuously. During weekends, I am usually physically active on Saturdays, while I relax and do homework on Sundays. I was curious to see the differences on various parameters.
Saturday
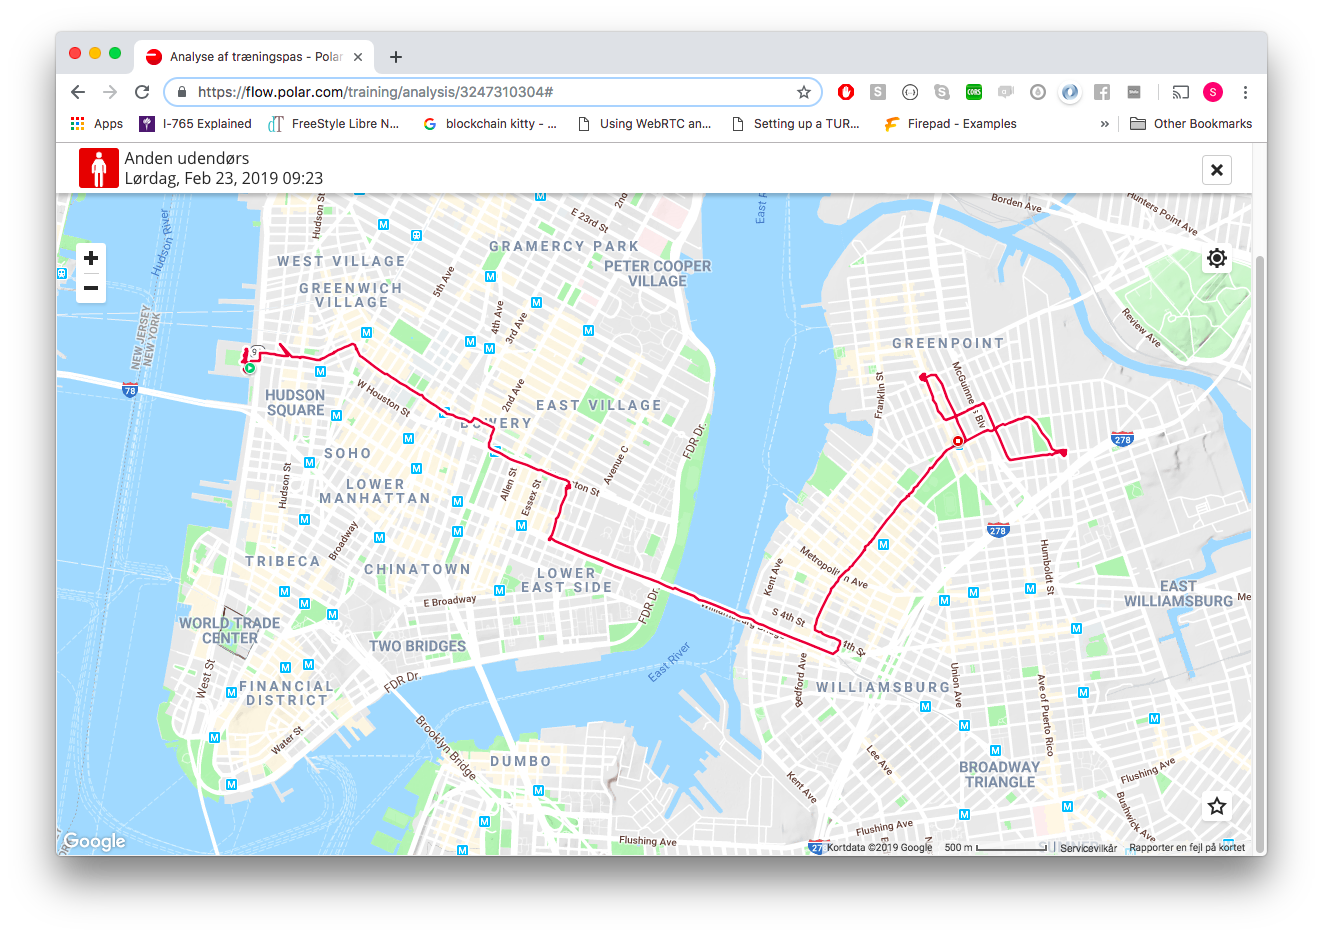
On Saturdays I usually go to Pier40 on the westside and play football for two hours. I forgot to turn the heartRate on for the trip there, so the measurements starts at my arrival. After that I go to Clinton Street and eat breakfast. I then cross the bridge to go home and take a nap. After a nap I go to the local Crunch gym in Greenpoint. The entire route is displayed on the image.
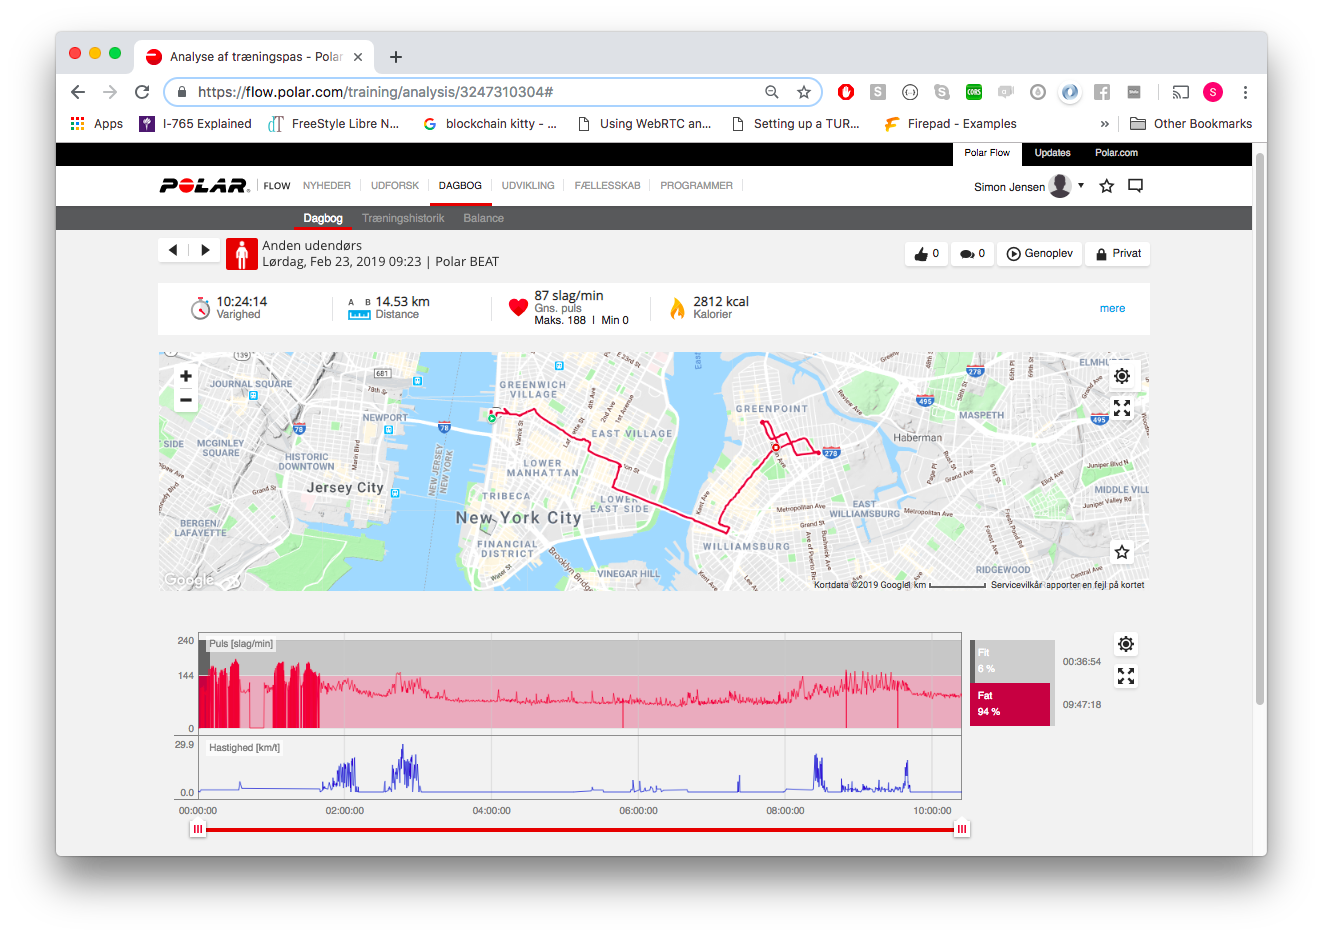
The above image (click for magnification) displays the correlation between speed, heartRate and position. During the two hours of football the connection to my HeartRate sensor would come and go depending on how close I was to my phone (on the sideline). This explains the density of red lines - constantly skipping between high values and zero. Peak values are still readable though. No movement is detected because we were moving on a small area. This can be seen when zooming in on the map using the app.
After the training session the speed picks up as I bike to a restaurant for breakfast. After a small break speed increases again as I continue my way back to Greenpoint. When I get back I take a nap and relax for several hours before I go to the local Crunch Gym - where the pulse picks up again.
Here's my training session extracted.
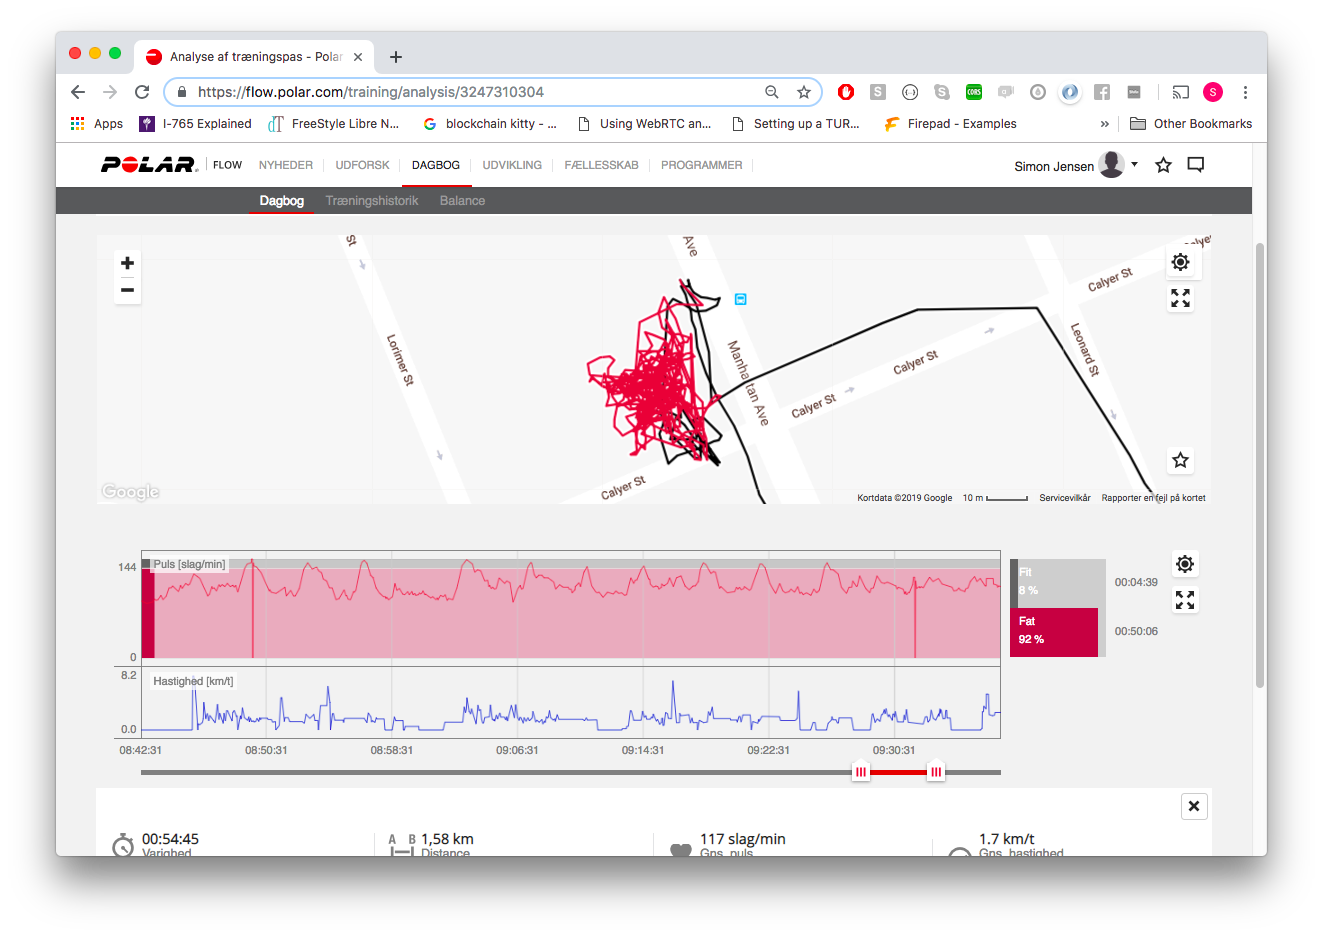
Its interesting that you can basically see each set for each exercise I performed by analyzing the peak values of my heartRate.
Sunday
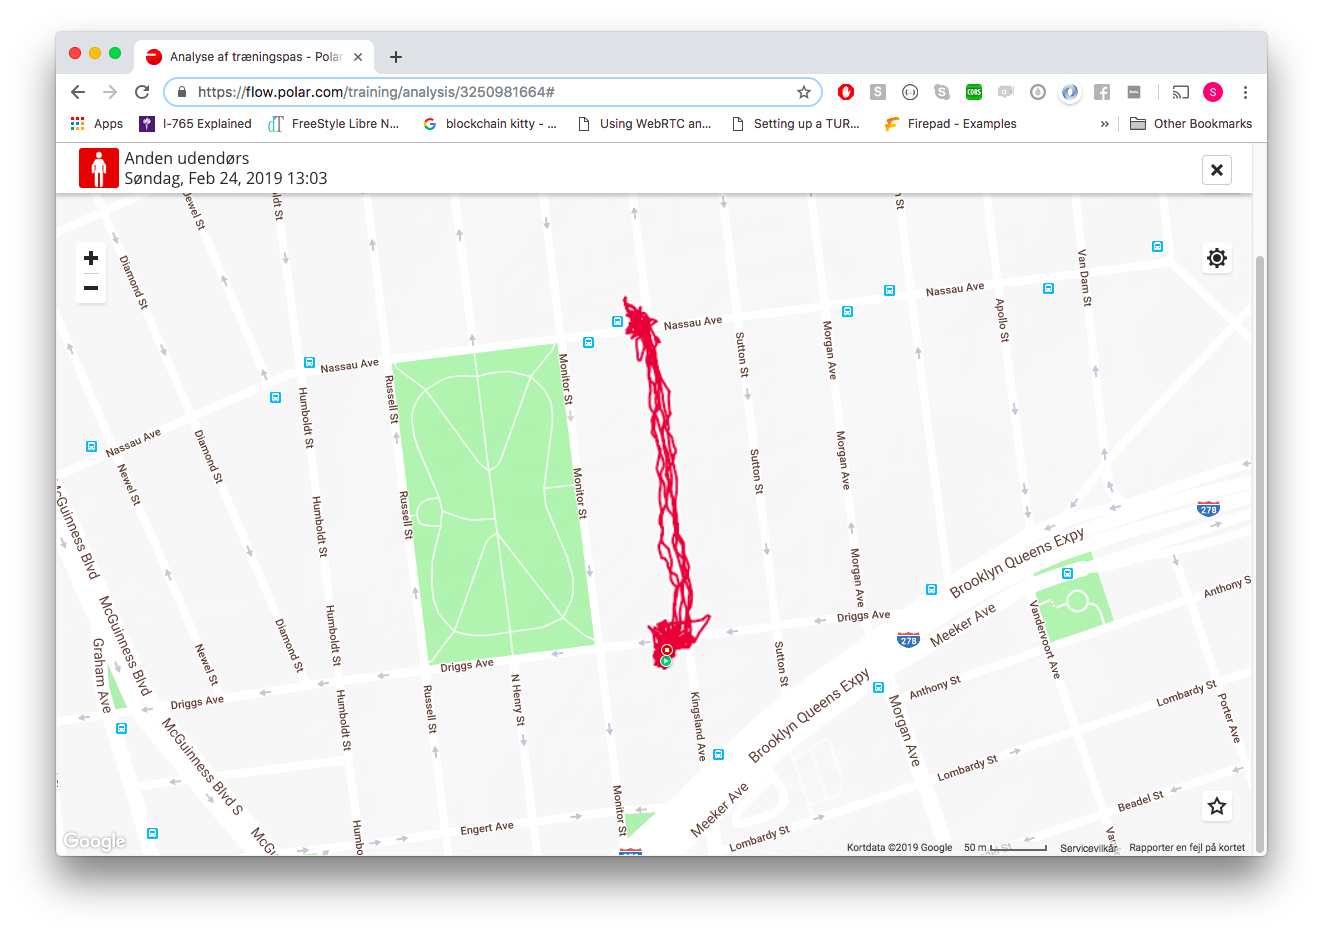
My sunday was very quiet. All I did was walk to my Deli on the corner and to the Laundromat a couple of times to pick up laundry.
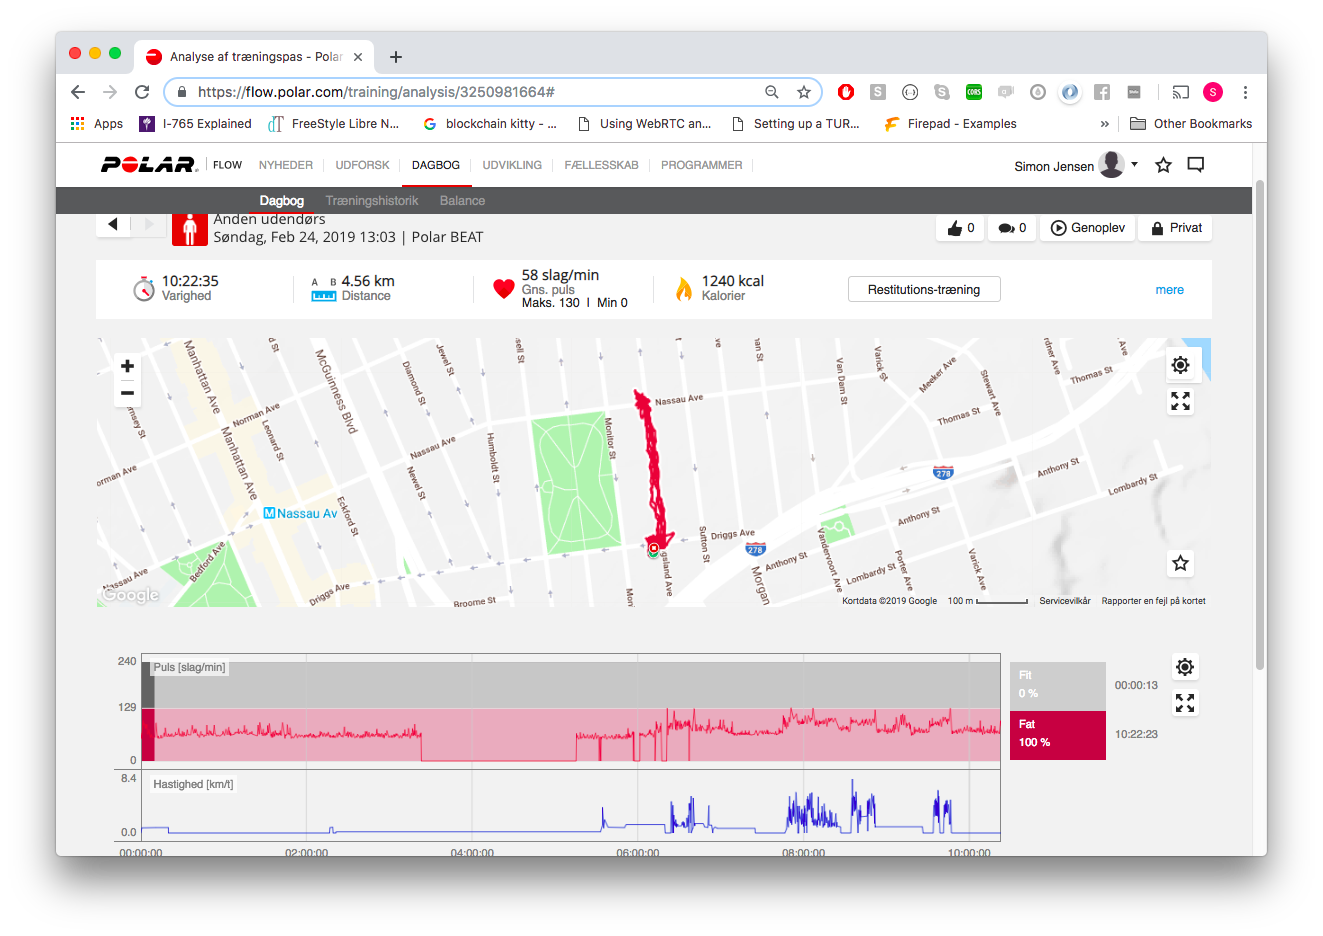
Physically, this day was very inefficient which is also clear from the numbers. Nothing ever really moved, except for when I had a fallout of the heartRate signal.
It is interesting to compare the days and see the differences in numbers - Although I am skeptical about some of the numbers (maybe due to loss of connection sometimes). There are some clear differences in kcal, active minutes and average pulse throughout the day. This makes sense when comparing it to my levels of activity.
It's impressive to see how far the collection of biometrics has come. In this project I was curious to see if I could re-assemble a day based on the values I had collected. I feel like I pretty much could. An interesting feature to potentially add to this data representation of my day is blood-sugar. With insulin peaks for each meal I ate during the day, I think I could have had a very accurate data representation of my weekend.
Knowing very little about the fit-bit I wonder if it collects similar measurements? Or whether it could add an additional layer? Like sleep?